Abstract
Forest and land fires (karhutla) were among Indonesia's largest environmental problems in 2026. In late October the number of satellite hotspots in the six priority provinces fell sharply as rain arrived, and that figure is easily read as a sign that the crisis is over. This article aims to analyse the official hotspot data for October 2026 and explain how to read them, including monitoring technology companies can use. It analyses official statistics from Ministry of Forestry press releases, disaster agency statements, regulations, and journal articles searched on 2 November 2026. Weekly data show hotspots rising from 4,189 to 5,671 over the first three weeks of October and then falling to 97 in the final week, with Central Kalimantan accounting for two thirds of the peak week. A hotspot is a thermal anomaly detected by satellite, not a count of fires or of burned area, and smouldering peat can persist without being detected. The article concludes that a fall in hotspots needs to be confirmed by field checks and peat groundwater data, and that companies should use the rainy season to fix their monitoring systems before the next dry season.
Keywords: forest and land fires, hotspots, peatland, groundwater level, remote sensing
Introduction
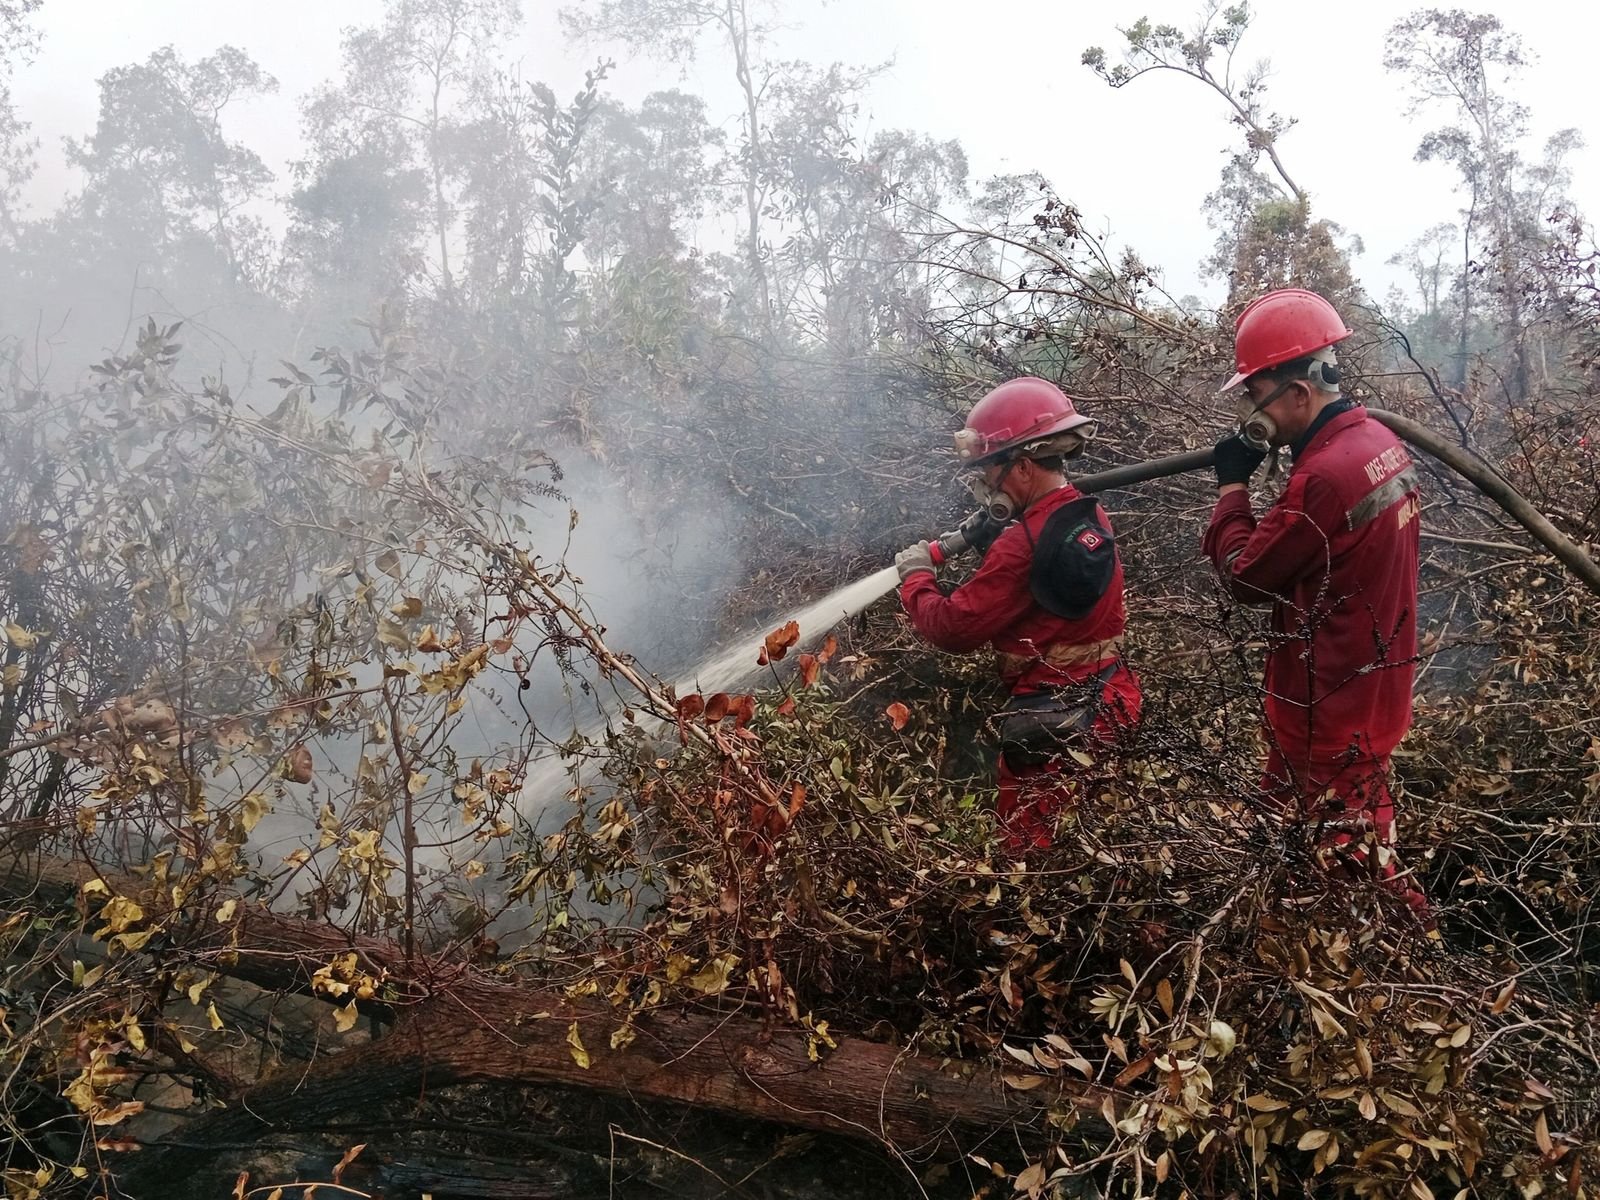
During October 2026, the fire monitoring system (SiPongi) of Indonesia's Ministry of Forestry recorded 4,189 hotspots in the six fire-prone priority provinces from 4 to 10 October, 4,545 from 11 to 17 October, 5,671 from 18 to 24 October, and only 97 from 25 to 31 October (Investortrust, 2026). At the observation of 27 October 2026 at 21.00 Western Indonesia Time, all six provinces showed no high-confidence hotspots (Kementerian Kehutanan [Kemenhut], 2026d). Three days later, the National Disaster Management Agency (BNPB) reported that fires were still burning in East Kalimantan, Central Sulawesi, Southeast Sulawesi, Maluku, and South Papua, with 1,410 hectares still on fire (Prihammanda, 2026).
According to SiPongi data reported in the press, the area burned from January to July 2026 reached 202,004.30 hectares, 69 percent more than in the same period of 2025 (Harususilo, 2026). The rainy season has only just begun: the Meteorology, Climatology, and Geophysics Agency (BMKG) projected that 185 seasonal zones, or 24.66 percent of Indonesia's land area, would enter the rainy season in November 2026 and 266 zones, or 17.31 percent, in December 2026 (Sandi, 2026).
A sharp fall is easily taken to mean the fires are over, yet the ministry has repeatedly stated that a hotspot indicates a surface temperature anomaly, that one fire can be detected as several hotspots, and that zero hotspots does not mean every fire is out (Kemenhut, 2026a, 2026d). On peatland, misreading the numbers can lead to patrols being stood down too early, and guidance linking official figures to company monitoring is rarely available.
This article aims to analyse the official hotspot data for October 2026 and explain how to read them, including the monitoring technology companies can use to confirm the figures in the field.
Methods
This analysis of official statistics involved no new field measurements. Daily figures were taken from four Ministry of Forestry press releases dated 9, 20, 26, and 28 October 2026. Weekly figures by province come from SiPongi as reported by Investortrust on 1 November 2026, because the SiPongi portal could not be reached from the author's network. BNPB statements, the BMKG outlook, and burned-area figures came from national media that name their source.
Scientific and regulatory sources were searched on 2 November 2026 with a general web search engine, using terms such as titik panas SiPongi Oktober 2026, luas karhutla 2026, BMKG rainy season 2026/2027, MODIS active fire collection 6, VIIRS 375 m, peat groundwater compliance point, and tropical peatland restoration. Journal metadata and abstracts were checked on publisher or repository pages, and Ministerial Regulation P.15/2017 was read from a FAOLEX copy. The peraturan.go.id site was unreachable, so Government Regulation 57/2016 and Law 32/2009 were verified through extracts and secondary summaries.
The year range was 2009 to 2026, covering official data, regulations in force, and peer-reviewed articles; news served as context and as a carrier of official data. Percentage changes, provincial shares, and ratios were calculated by the author and rounded to one decimal place. No screening counts were recorded.
Results and Discussion
Sources and Definitions
SiPongi counts high-confidence hotspots from NASA's Terra/Aqua, SNPP, and NOAA-20 satellites (Kemenhut, 2026d). The MODIS sensor on Terra and Aqua uses a contextual algorithm on pixels of about 1 km, with a global daytime commission error of 1.2 percent in Collection 6 (Giglio et al., 2016). The VIIRS sensor on SNPP and NOAA-20 has a 375 m day and night product with commission errors below 1.2 percent in its initial assessment (Schroeder et al., 2014).

A hotspot is therefore one pixel showing a thermal anomaly at the moment a satellite passes over. It is not a count of fires or of area, and every detection must be verified on the ground (Kemenhut, 2026a). In the author's interpretation, daily counts also depend on satellite passes and cloud cover, so one day's figure is a signal rather than a measurement.
October Weekly Trend
The author calculates a rise of 8.5 percent from the first to the second week and 24.8 percent from the second to the third. The final week was 98.3 percent below the third week and 98.0 percent below the average of the previous three weeks (4,801.7 hotspots), consistent with the reported fall of 98 percent (Investortrust, 2026).
Daily national figures are more volatile, dropping from 1,176 hotspots on 7 October to 387 on 8 October, a fall of 67.1 percent (Kemenhut, 2026a), yet the following week's total rose to 4,545. In the author's view, this shows that a one-day fall is not a trend.
The fall in the final week coincided with rain on 25 October at several locations in South Sumatra, Central Kalimantan, and South Kalimantan (Kemenhut, 2026c), and with BNPB cloud seeding over Central Kalimantan and South Sumatra on 29 October (Prihammanda, 2026). The data cannot separate these effects.
Distribution by Province
In the week of 18 to 24 October, Central Kalimantan recorded 3,801 hotspots, South Sumatra 725, West Kalimantan 652, South Kalimantan 354, Jambi 139, and Riau none. In the following week the figures were 55, 8, 20, 7, 7, and none (Investortrust, 2026). Central Kalimantan's share was 67.0 percent in the peak week and 56.7 percent in the final week, so one province drove most of the pattern.
The six provinces' share of the national daily count also shrank, from 35.3 percent on 19 October (172 of 487 hotspots) to 17.7 percent on 25 October (26 of 147) and zero on 27 October (Kemenhut, 2026b, 2026c, 2026d). This matches BNPB's shift of focus to five other provinces, mostly in eastern Indonesia (Prihammanda, 2026). For companies in South Papua, Sulawesi, Maluku, or East Kalimantan, a falling national number says little about local risk.
Hotspots Are Not Area
SiPongi recorded 202,004.30 hectares burned for January to July (Harususilo, 2026), while the indicative burned area model of the MADANI Berkelanjutan foundation estimated 1.32 million hectares for January to August, 51.14 percent of it inside permit and concession areas (Firmansyah, 2026). The second is about 6.5 times the first, but periods and methods differ, so either figure should be quoted with both.
Using MODIS burned area data and Landsat land cover maps for 2001 to 2018, Vetrita and Cochrane (2020) found that peat covers only 13 percent of Sumatra and Kalimantan, yet about 2.8 percent of the peat area burned each year, compared with 0.6 percent of non-peat land.
On peat, embers can persist below the surface after they are no longer detected, so wetting and cooling continue after the satellite count falls (Kemenhut, 2026d).
Peat and Water Table
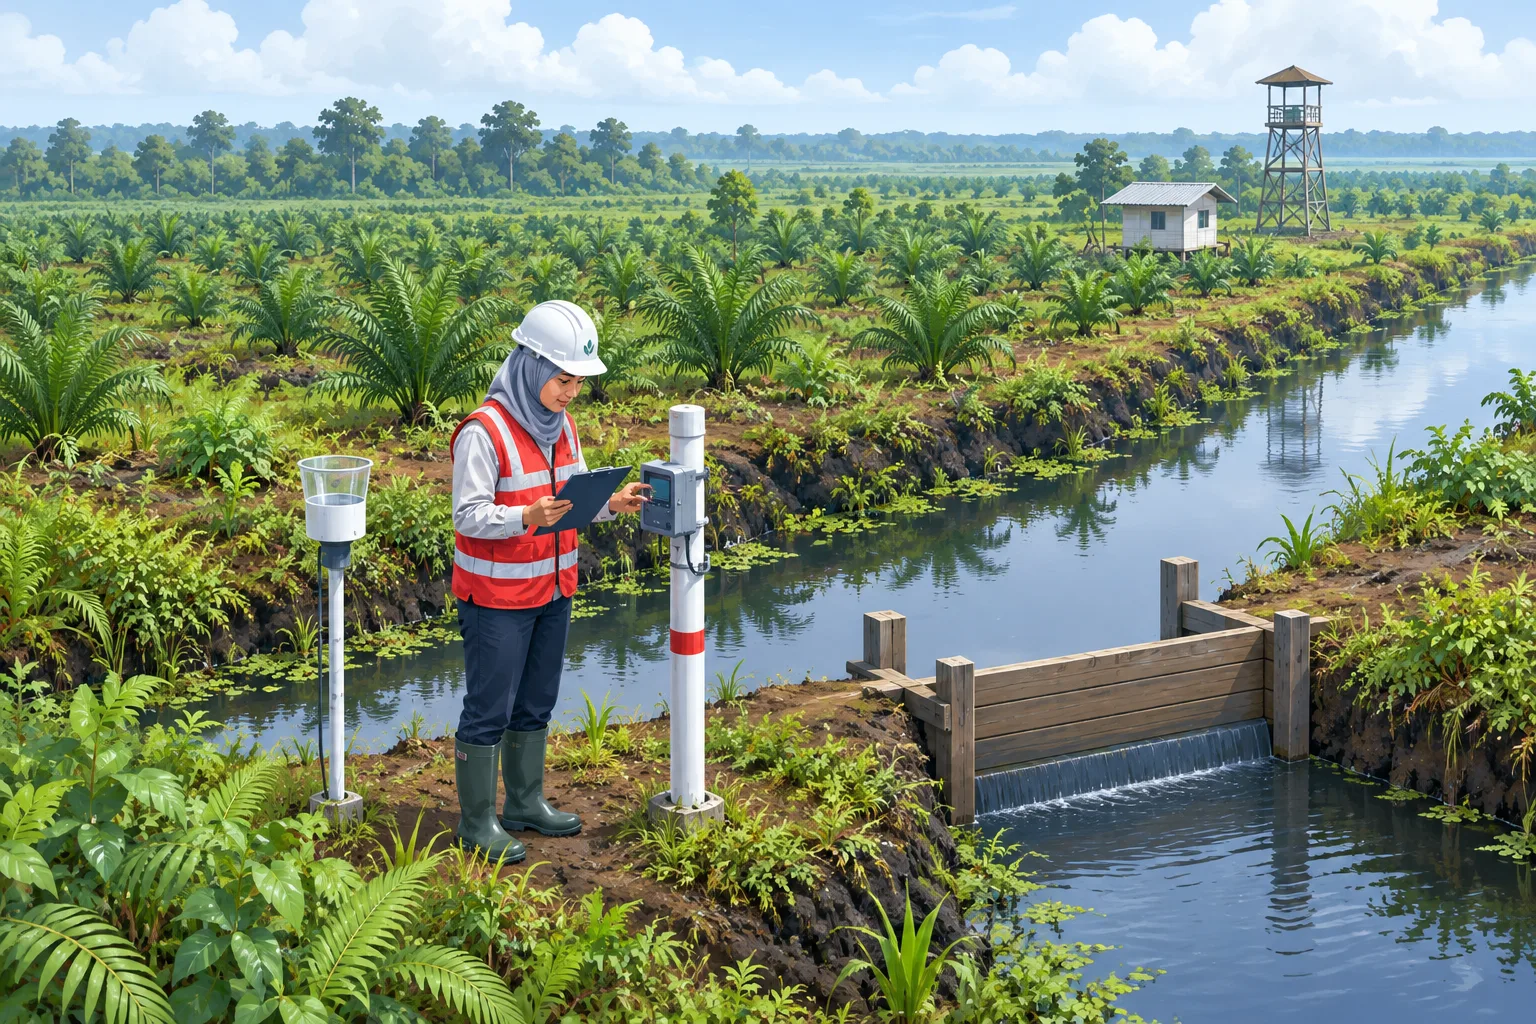
Government Regulation No. 57 of 2016 amending Government Regulation No. 71 of 2014 on the Protection and Management of Peat Ecosystems sets a groundwater level more than 0.4 metres below the peat surface at a compliance point as one of the criteria for damaged cultivated peat (Pemerintah Republik Indonesia, 2016). The procedure is set out in Regulation of the Minister of Environment and Forestry No. P.15/MENLHK/SETJEN/KUM.1/2/2017 on Procedures for Measuring Groundwater Levels at Peat Ecosystem Compliance Points (Kementerian Lingkungan Hidup dan Kehutanan [KLHK], 2017). Compliance points cover at least 15 percent of the main planting plots or production blocks (Article 2). Levels are measured manually at least once every 2 weeks or automatically with a data logger at least once a day, with at least one data logger per water management zone (Articles 5 and 6). One rain gauge serves 20 compliance points (Article 7), and results are reported every 3 months (Article 8).
In Tanjung Jabung Timur, Jambi, a study of 916 hotspots from 2019 to 2021 found a moderate negative correlation between hotspots and water level (r = -0.408) and a strong positive correlation between water level and rainfall (r = 0.705) (Putri et al., 2022). In Kalimantan, models that included hydrological variables predicted burned area better than models based on climate indices alone (Taufik et al., 2017). The author interprets the water table as a leading indicator, whereas a hotspot appears only after a fire has started.
Technology for Companies
The author maps the following options from the data and sources above:
- A network of groundwater data loggers and rain gauges at the density and frequency set by P.15/2017, with daily data shown on one dashboard (KLHK, 2017).
- MODIS and VIIRS hotspot feeds used as triggers for field checks, not as a measure of area or of fires being out (Giglio et al., 2016; Schroeder et al., 2014).
- Drones for hard-to-reach sites, as used in Tabalong, South Kalimantan (Kemenhut, 2026c).
- Rewetting through canal blocking and revegetation, which a literature review found has mostly been applied as small-scale trials, so results need monitoring (Dohong et al., 2018).
- A fire control organisation, crew, and equipment under Ministerial Regulation P.32/2016 (KLHK, 2016), and the ban on clearing land by burning in Article 69(1)(h) of Law No. 32 of 2009 on Environmental Protection and Management (Republik Indonesia, 2009).
- Action thresholds tied to rainfall forecasts. An analysis of the 2015 season found fire activity to be highly sensitive to long dry periods with less than 4 mm of rain per day and recommended early warning triggers based on precipitation forecasts (Field et al., 2016).
Limitations
The weekly provincial and burned-area figures come from press reports citing official or institutional sources, and their aggregation basis could not be confirmed. The official texts of Government Regulation 57/2016 and Law 32/2009 were not opened directly, and later amendments were not reviewed. Some journal articles were read at abstract level only. The analysis is descriptive, a correlation from one district may not hold elsewhere, and the data run only to 31 October 2026.
Conclusions and Recommendations
Hotspots in the six priority provinces rose over the first three weeks of October 2026, peaked from 18 to 24 October, mainly in Central Kalimantan, and then fell by about 98 percent. Three limits apply: a hotspot is neither a fire count nor an area, daily figures are volatile, and smouldering peat can persist undetected. The fires have also shifted to other provinces, mostly in the east.
Practical recommendations for companies managing land:
- Base decisions to scale down patrols on weekly totals and field checks, not on a single day's count.
- Check compliance points, data loggers, and rain gauges against P.15/2017 during the rainy season.
- Set action thresholds based on groundwater levels and rainfall forecasts before the 2027 dry season.
Further research should validate 2026 SiPongi hotspots against field checks and compare official and independent burned-area methods.
Companies organising their register of environmental obligations, including groundwater monitoring, can see the environmental compliance and PROPER service, while fire crew readiness can be tested through emergency preparedness drills.
This article is general information and not legal or professional advice for any specific case.
References
- Dohong, A., Aziz, A. A., & Dargusch, P. (2018). A review of techniques for effective tropical peatland restoration. Wetlands, 38(2), 275-292. https://doi.org/10.1007/s13157-018-1017-6
- Field, R. D., van der Werf, G. R., Fanin, T., Fetzer, E. J., Fuller, R., Jethva, H., Levy, R., Livesey, N. J., Luo, M., Torres, O., & Worden, H. M. (2016). Indonesian fire activity and smoke pollution in 2015 show persistent nonlinear sensitivity to El Niño-induced drought. Proceedings of the National Academy of Sciences, 113(33), 9204-9209. https://doi.org/10.1073/pnas.1524888113
- Firmansyah, M. (2026, 2 Oktober). Karhutla bakar 1,32 juta hektar hingga Agustus 2026, lahan gambut banyak jadi kebun sawit. Kompas.com. https://lestari.kompas.com/read/2026/10/02/194006786/karhutla-bakar-132-juta-hektar-hingga-agustus-2026-lahan-gambut-banyak-jadi
- Giglio, L., Schroeder, W., & Justice, C. O. (2016). The collection 6 MODIS active fire detection algorithm and fire products. Remote Sensing of Environment, 178, 31-41. https://doi.org/10.1016/j.rse.2016.02.054
- Harususilo, Y. E. (2026, 3 Oktober). Luas karhutla 2026 melonjak, perbaikan tata kelola lahan dan gambut jadi sorotan. Kompas.com. https://lestari.kompas.com/read/2026/10/03/093745086/luas-karhutla-2026-melonjak-perbaikan-tata-kelola-lahan-dan-gambut-jadi
- Investortrust. (2026, 1 November). Hotspot karhutla turun 98% pada pekan terakhir Oktober 2026. https://investortrust.id/national/121184/hotspot-karhutla-turun-98-pada-pekan-terakhir-oktober-2026
- Kementerian Kehutanan. (2026a, 9 Oktober). Hotspot nasional turun 789 titik, Kemenhut terus perkuat penanganan karhutla [Siaran pers]. https://www.kehutanan.go.id/news/hotspot-nasional-turun-789-titik-kemenhut-terus-perkuat-penanganan-karhutla
- Kementerian Kehutanan. (2026b, 20 Oktober). Hotspot turun 617 titik, operasi karhutla tetap diperkuat [Siaran pers]. https://www.kehutanan.go.id/news/hotspot-turun-617-titik-operasi-karhutla-tetap-diperkuat
- Kementerian Kehutanan. (2026c, 26 Oktober). Hotspot turun jadi 147 titik, hujan mulai turun, operasi lapangan tetap berjalan [Siaran pers]. https://www.kehutanan.go.id/news/hotspot-turun-jadi-147-titik-hujan-mulai-turun-operasi-lapangan-tetap-berjalan
- Kementerian Kehutanan. (2026d, 28 Oktober). Hotspot nasional turun jadi 79 titik, enam provinsi prioritas nihil [Siaran pers]. https://www.kehutanan.go.id/news/hotspot-nasional-turun-jadi-79-titik-enam-provinsi-prioritas-nihil
- Kementerian Lingkungan Hidup dan Kehutanan. (2016). Peraturan Menteri Lingkungan Hidup dan Kehutanan Nomor P.32/MENLHK/SETJEN/KUM.1/3/2016 tentang Pengendalian Kebakaran Hutan dan Lahan. Berita Negara Republik Indonesia Tahun 2016 Nomor 583. https://peraturan.bpk.go.id/Details/298069
- Kementerian Lingkungan Hidup dan Kehutanan. (2017). Peraturan Menteri Lingkungan Hidup dan Kehutanan Nomor P.15/MENLHK/SETJEN/KUM.1/2/2017 tentang Tata Cara Pengukuran Muka Air Tanah di Titik Penaatan Ekosistem Gambut. Berita Negara Republik Indonesia Tahun 2017 Nomor 337. https://faolex.fao.org/docs/pdf/ins174419.pdf
- Pemerintah Republik Indonesia. (2016). Peraturan Pemerintah Nomor 57 Tahun 2016 tentang Perubahan atas Peraturan Pemerintah Nomor 71 Tahun 2014 tentang Perlindungan dan Pengelolaan Ekosistem Gambut. Lembaran Negara Republik Indonesia Tahun 2016 Nomor 260.
- Prihammanda, B. A. (2026, 30 Oktober). Karhutla di enam provinsi padam, Papua Selatan dan Kaltim masih terbakar. Republika. https://news.republika.co.id/berita/tnq2h2393/karhutla-di-enam-provinsi-padam-papua-selatan-dan-kaltim-masih-terbakar
- Putri, A. I., Syaufina, L., & Puspaningsih, N. (2022). Ground water level as an indicator of fire in Tanjung Jabung Timur, Jambi Province. Jurnal Pengelolaan Sumberdaya Alam dan Lingkungan, 12(4), 749-756. https://doi.org/10.29244/jpsl.12.4.749-756
- Republik Indonesia. (2009). Undang-Undang Nomor 32 Tahun 2009 tentang Perlindungan dan Pengelolaan Lingkungan Hidup.
- Sandi, F. (2026, 26 September). BMKG ungkap awal dan puncak musim hujan di RI. CNBC Indonesia. https://www.cnbcindonesia.com/tech/20260925201019-37-771072/bmkg-ungkap-awal-dan-puncak-musim-hujan-di-ri
- Schroeder, W., Oliva, P., Giglio, L., & Csiszar, I. A. (2014). The New VIIRS 375 m active fire detection data product: Algorithm description and initial assessment. Remote Sensing of Environment, 143, 85-96. https://doi.org/10.1016/j.rse.2013.12.008
- Taufik, M., Torfs, P. J. J. F., Uijlenhoet, R., Jones, P. D., Murdiyarso, D., & Van Lanen, H. A. J. (2017). Amplification of wildfire area burnt by hydrological drought in the humid tropics. Nature Climate Change, 7(6), 428-431. https://doi.org/10.1038/nclimate3280
- Vetrita, Y., & Cochrane, M. A. (2020). Fire frequency and related land-use and land-cover changes in Indonesia's peatlands. Remote Sensing, 12(1), 5. https://doi.org/10.3390/rs12010005