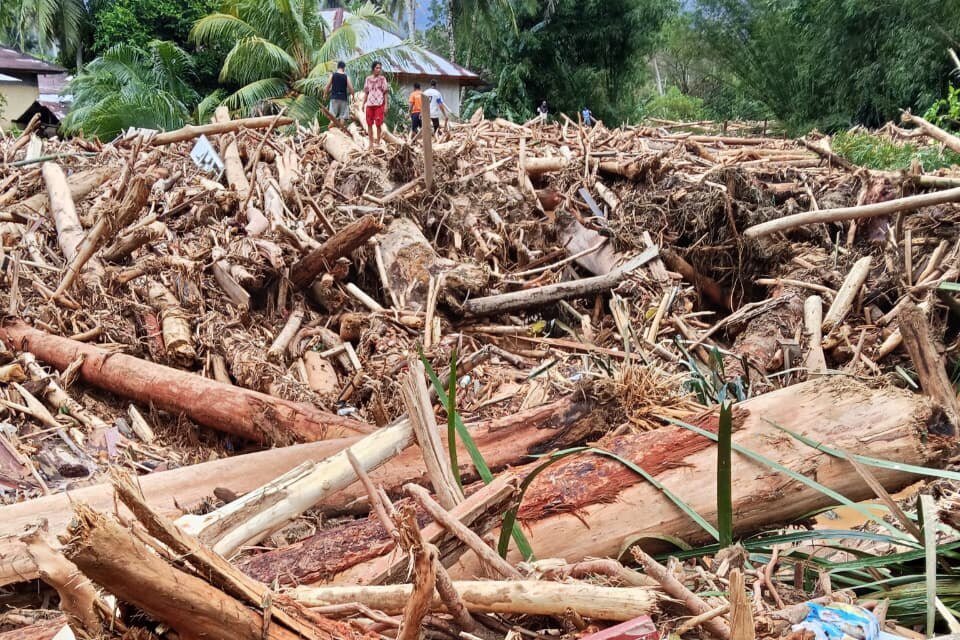
Between 25 and 27 November 2025, Indonesia's Meteorology, Climatology and Geophysics Agency recorded extreme rainfall in several parts of Sumatra, including 310.8 mm a day in North Aceh, 262.2 mm a day in Medan, 229.7 mm a day in Central Tapanuli and 154 mm a day in Padang Pariaman. The rain was driven by Tropical Cyclone Senyar, which formed in the Strait of Malacca, together with an equatorial Rossby wave active over the same area (Badan Meteorologi, Klimatologi, dan Geofisika [BMKG], 2025).
The flash floods and landslides that followed quickly raised questions about the forests upstream. On 5 December 2025 the Ministry of Environment suspended three companies in the upper Batang Toru watershed and required environmental audits for all companies in the upper watershed from 6 December. From helicopter surveys, the ministry reported land clearing for hydropower, industrial timber plantations, mining and oil palm which, in its words, triggered large volumes of timber debris and erosion (Kementerian Lingkungan Hidup [KLH], 2025). This article reads the official data available to see what can and cannot yet be concluded.
The Data Source
The main source is the Ministry of Forestry's 2024 statistics book, updated on 19 November 2025. We use three of its tables: the 2024 land cover recalculation, 2024 net deforestation by province and forest function with data as of 31 December 2024, and the area of critical land (Kementerian Kehutanan [Kemenhut], 2025). The percentages below are our own calculations from the figures in those tables.
What the Figures Show
National net deforestation in 2024 was 175,437.7 hectares. Aceh accounted for 11,208.5 hectares, North Sumatra 7,034.9 hectares and West Sumatra 6,634.2 hectares (Kemenhut, 2025). Together that is 24,877.6 hectares, or about 14.2 percent of the national figure. Of this, 10,767.0 hectares (43 percent) lay in non-forest land use areas, 4,898.3 hectares (20 percent) in protection forest and 2,396.4 hectares (10 percent) in conservation forest.
Set against the forest remaining in 2024, about 3.12 million hectares in Aceh, 1.93 million hectares in North Sumatra and 1.88 million hectares in West Sumatra, one year of deforestation equals 0.35 to 0.36 percent of the forest in each province. The more striking numbers are in the land cover table. The protection forest zone without forest cover reached 152,548.89 hectares in Aceh, 460,339.61 hectares in North Sumatra and 198,558.28 hectares in West Sumatra (Kemenhut, 2025). In North Sumatra, that means almost 39 percent of the protection forest zone is no longer forested.
How to Read Them
We take two messages from these data. First, forest loss in a single year looks small against what remains, but the long-term legacy is large, especially in zones designated for protection. A watershed's protective function depends on its actual cover and land condition, not on its status on a map. Second, provincial data cannot identify the cause of flooding in any particular watershed.
Research also counsels caution. A study of 31 river basins in Peninsular Malaysia from 1984 to 2000 found that converting inland tropical forest to oil palm and rubber significantly increased the number of days flooded in the wettest months (Tan-Soo et al., 2016). On the other hand, van Dijk et al. (2009) showed how easily country-level statistics mislead: population density alone explained up to 83 percent of the variation in reported flood occurrence. They concluded that removing trees does not affect large floods, although the landscape changes that come with it can under some circumstances. With rainfall above 300 mm a day, the right question in our view is not whether forests matter, but how much disturbed land added to the timber debris, sediment and speed of the flow. That can only be answered by examination at site level.
Limits of the Data
The deforestation figures in the statistics book are net provincial totals for 2024, so they do not show where clearing occurred within a watershed and do not cover 2025. The critical land data also need care. North Sumatra's critical land was recorded at 1,338,809.95 hectares in 2018 and 41,416.94 hectares in 2022, a fall of about 97 percent, while the ministry notes that these data are updated every 5 years and reviewed every 2 years (Kemenhut, 2025). In our view a drop of that size should be checked against changes in method before it is used as evidence of recovery.
Steps for Companies
The environment ministry says it is tightening checks on environmental approvals and spatial plan compliance for activities on steep slopes, in upper watersheds and along river channels (KLH, 2025). Companies operating in similar areas can prepare by:
- matching the actual area and location of land clearing against their environmental approval documents and management plans;
- checking erosion, sediment and drainage controls before the peak of the rainy season;
- mapping activities on steep slopes and river buffer zones;
- keeping environmental monitoring records in good order as evidence for an audit.
How Nusa Safety Helps
Nusa Safety supports companies that need to review how their activities match their environmental documents through DELH and DPLH Environmental Evaluation, and helps set up routine monitoring and reporting through Environmental Compliance and PROPER. For a specific need, please contact the Nusa Safety team.
This article is general information and not legal or professional advice for any specific case.
References
- Badan Meteorologi, Klimatologi, dan Geofisika. (2025, November 27). Prospek cuaca mingguan periode 28 November-04 Desember 2025: Siklon Tropis "Senyar" punah, gelombang atmosfer pengaruhi cuaca signifikan di Indonesia [Weekly weather outlook for 28 November to 4 December 2025: Tropical Cyclone Senyar dissipates, atmospheric waves drive significant weather in Indonesia]. https://www.bmkg.go.id/cuaca/prospek-cuaca-mingguan/prospek-cuaca-mingguan-periode-28-november-04-desember-2025-siklon-tropis-senyar-punah-gelombang-atmosfer-pengaruhi-cuaca-signifikan-di-indonesia
- Kementerian Kehutanan Republik Indonesia. (2025). Buku statistik Kementerian Kehutanan tahun 2024 [Ministry of Forestry statistics book 2024] (Updated 19 November 2025). https://www.kehutanan.go.id/s/uploads/Buku_Statistik_2024_Pembaruan_191125_1_cb68f4d25d.pdf
- Kementerian Lingkungan Hidup/Badan Pengendalian Lingkungan Hidup. (2025, December 5). Banjir Sumatera: Menteri LH perintahkan hentikan operasional tambang, sawit, dan PLTA, audit lingkungan wajib segera dilakukan [Sumatra floods: Environment minister orders mining, oil palm and hydropower operations halted and environmental audits carried out] (Press Release No. SR.319/HUMAS/KLH-BPLH/12/2025). https://kemenlh.go.id/news/detail/banjir-sumatera-menteri-lh-perintahkan-hentikan-operasional-tambang-sawit-dan-plta-audit-lingkungan-wajib-segera-dilakukan
- Tan-Soo, J.-S., Adnan, N., Ahmad, I., Pattanayak, S. K., & Vincent, J. R. (2016). Econometric evidence on forest ecosystem services: Deforestation and flooding in Malaysia. Environmental and Resource Economics, 63(1), 25-44. https://doi.org/10.1007/s10640-014-9834-4
- van Dijk, A. I. J. M., van Noordwijk, M., Calder, I. R., Bruijnzeel, S. L. A., Schellekens, J., & Chappell, N. A. (2009). Forest-flood relation still tenuous: Comment on 'Global evidence that deforestation amplifies flood risk and severity in the developing world' by C. J. A. Bradshaw, N. S. Sodhi, K. S.-H. Peh and B. W. Brook. Global Change Biology, 15(1), 110-115. https://doi.org/10.1111/j.1365-2486.2008.01708.x